
Tags
Animals, Biodiversity, Biology, DNA, Dog Breeding, Dog Breeds, Dogs, Genetics, Great Dane, Heterozygosity, Inbreeding, Natural History, Nature
Well, this is MEGA-interesting news. Carol Beuchat of the Institute of Canine Biology has compiled a list of Genetic Diversity in all breeds – including Grey Wolves and mixed breeds – from the data of the MyDogDNA site. Not only the list is widely inclusive, it’s comparative, too. A few breeds are missing (due to lack of available information) but the one we are interested in, is included.
![]()
You can view and download a copy of the Heterozygosity chart in its entirety here and you can read Carol’s article, with links to view the breed data in groups, here. The Great Dane is listed in the Working group (as per AKC classification, since the list is US – based), here.
There’s good news and bad news and mixed news.
First of all, the Great Dane is listed in the bottom third of the list, which represents the breeds with the most heterozygosity, among all pedigree dogs. The mixed breeds are right at the bottom, of course, with a median of just below 44% heterozygosity. The horizontal red line above represents the median heterozygosity for all breeds, which is 34,6%. The horizontal green line is the median heterozygosity for mixed breed dogs. To the left of the chart we see breeds with low heterozygosity (high inbreeding) and as we go towards the right hand side heterozygosity increases. So, less diversity – and more inbreeding- to the left, more diversity – less inbred – to the right. The green arrow below points to our breed.

The above section shows is a close-up of where the Great Dane sits in the hetrozygocity vs inbreeding chart. Just a smidgen above the mean red line. A mere 0,2% in fact, above the median heterozygosity across breeds. Below that red line are the breeds that are in trouble, well above it and approaching the green line are those with robust genetic diversity. We are not among these – and we are not among those sinking, we are just hovering on the edge of the cliff, with a Great Dane median at 34,8%, in fact. (With the maximum in this scale showing as 50, but should be perceived as 100%). How does that sound? Well it sounds like an alert bell ringing with red lights flashing, actually. It sounds like a large chunk of heterozygosity lost, or down 10% in comparison with diverse and mixed breeds, already. It sounds like danger.
The good news is that it’s not too bad. It is manageable. We still have some genetic diversity left in the tank. If only people woke up to the sound of the bell and used it? I believe they are, from what I hear from a lot of good breeders from all around the world who are aware of the signs of depression – small litters, infertility, hereditary defects – and are using more and more carefully selected outcrosses and assortative mating (complimentary type matching without close inbreeding) rather than Brackett’s cursed recipe for disaster, euphemistically known as ‘linebreeding’. Others are unfortunately still blissfully unaware…they are the ones ruining it for the rest. And then we have the greeders who are totally in the Dark Ages, still using the rule of thumb that is firmly stuck in their mouths…
There’s more breed analyses to be found in the working group page and I copied them here for the readers:
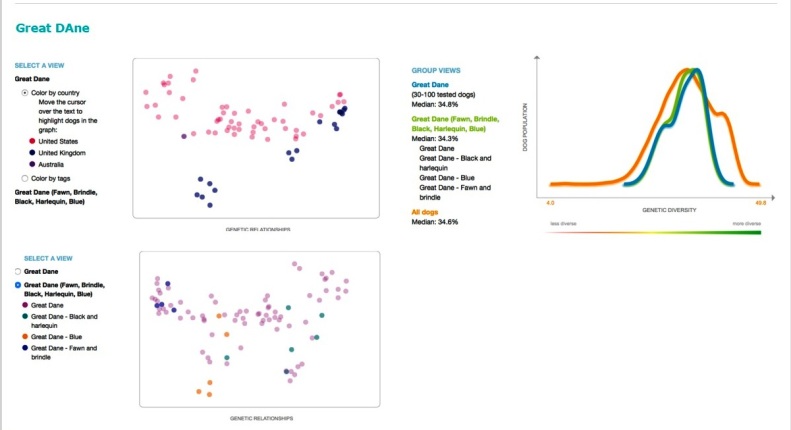
Graph one shows the geographic distribution of the samples so they are not just from the USA, but mostly from the US and the UK, and a few (?) from Australia:

The second graph is the important one, showing the breed’s heterozygosity percentage (blue curve), the median across color varieties (green) and the ‘control’ curve (the median across all breeds) in orange.

You will ask why the difference between the blue curve and the green curve if blue represents simply all the tested dogs of the breed and green just breaks them down into color varieties as they were indicated in the questionnaires? I had the same question myself. I suspected the difference was that some samples simply came from Great Danes that did not have their color recorded or from dogs outside acceptable colors – and the second explanation seemed more likely to me. You will notice that there is a small, 0,5% difference between the breed median (blue) and the recognized color varieties median (green) values and that again makes sense, with the recognized color varieties showing a very slightly less (0,5% less) heterozygosity.
I think that is reasonable if the balance came from dogs of non-acceptable colors (merles, -which in the US are still non-standard, although a very significant ballot is about to take place there to decide if merles will be accepted in the AKC/GDCA standard too-, blue harlequins – which are accepted in the UK but nowhere else – and other non-standard colors that however do occur in the breed). I did go to the MyDogDNA site to check again how the breed is listed and, as you might have guessed, it is listed in four different categories : Great Dane, Great Dane – Black and Harlequin, Great Dane – Blue & Great Dane -Fawn and Brindle, so if you wanted to have your Dane’s DNA tested and your dog’s color fell outside these color varieties you would send your sample under simply ‘Great Dane’ and that explains the tiny 0,5% difference in the median values, with all Great Danes having slightly more heterozygosity than just the recognized color varieties alone.
And how you might ask does the breed fair among others of the same group or type?
Not too bad, in fact – if we are talking about the best in a not so fantastic lot anyway. In the US the Great Dane is listed in the Working Group, so here is the list from the best values to the worst:
- Spanish Water Dog 39,4%
- Cane Corso 38,9 %
- East Siberian Laika 38,2 %
- Tibetan Mastiff 37,5 %
- Pyrenean Mastiff 37,0 %
- Beauceron 36,7 %
- Karelian Bear Dog 36,3 %
- GREAT DANE 34,8 %
- Alaskan Malamute 34,7 % and
- Giant Schnauzer 34,7 %
- Newfoundland 33,9 % and
- Portuguese Water Dog 33,9 %
- Black Russian Terrier 33,6 %
- Samoyed 33,3 %
- Saint Bernard 33,2 %
- Mastino Napoletano 33,1 %
- Siberian Husky 32,5 %
- Schnauzer (standard) 32, 4 %
- Great Pyrenees 31,9 %
- Mastiff 31,2 %
- Leonberger 31,0 %
- Dogue de Bordeaux 30,4 %
- Bullmastiff 29,6 % and
- Rottweiler 29,6 %
- Akita (American) 29, 4 %
- Bernese Mtn Dog 29,1 % and
- German Pinscher 29,1 %
- Dobermann 26,9 %
- Boxer 25,9 %
- Akita Inu 25,5 %
- Greater Swiss Mtn Dog 24,5 %
I colored the breeds that are above the median value of 34,6 % (red line) of all breeds in green and those below it in red.
I also went into other groups to seek breeds that are included in the FCI group II and in particular, in the dreaded mastiff section that our breed currently sits in. Note that the ‘Molossoid‘ breeds median given in the data collected by Carol is a mere 31,8 %, considerably lower than the Dane’s 34,8 %. Unfortunately I could not find all of them.
The Bulldog is at 28,2 %, the Shar Pei at 33,6 %, the Affenpinscher at 30,6 %, the Miniature Pinscher at 32,9 % and the Miniature Schnauzer at 29,1 %. But the newest ‘acquisition’ of the FCI’s second group, the (provisionally included) Danish-Swedish Farmdog is a true genetic diversity champion, right up in the top ten all breeds, with a whopping 41,5 % (not surprisingly) while a breed unknown to most, the Kritikos Lagonikos (Cretan Hound) is also right up there, although, I suspect, with a small sample. It’s hugely significant though as the Cretan from Greece could be a great donor candidate for breeds that are looking for a blood transfusion to save them from fatal hereditary diseases and genetic bottlenecks.
The poor Gray Wolf is not doing at all well with a median in the 26% territory, the Pug is at a very poor 24,5 % and the Irish Wolfhound is even worse at 25,3 %, while the Greyhound is at a worrying 31,9 % – but I suspect the results could be much better if coursing and racing dogs were included, as they have their own registries outside Kennel Clubs. And where is the hugely popular and populous German Shepherd Dog, you might ask ? at merely 31,5 %, not looking very well, well below the Sheepdogs median of 34,1 %. As for the Labrador Retrievers, the number one breed in popularity in the US and the UK, it’s not doing too brightly at 35, 4 %, especially bad if one thinks the Labrador had a huge genetic basis to start with, yet it has now an estimated population size in the UK of merely 81,7 dogs; the Golden is not at all better at 32 %. The Retriever breeds median value is just 33,2 %, and one has to wonder where did all the genetic diversity get squandered; but I think we all know the answer to that…
UPDATE:
Breeds with the BEST & WORST genetic diversity

Thank you Maria! I have been struggling with the idea of breeding Splash to Kaos. They are total outcrosses, but he compliments and should help correct her few weaknesses. The breeder wanted to me to line breed. I have been convinced to fix her problems she needs an outcross, as she is very tightly line bred. This article cemented my decision! Logan Date: Mon, 28 Mar 2016 20:21:13 +0000 To: lwrees72@hotmail.com
LikeLiked by 2 people
I absolutely b e l i e v e you are right in your thinking! Your instinct has been showing you the way all along – I think they are made for each other and wish you all the best, my friend ! Hugs to my favorite hunk ! (Not yourself lol, Kaos of course ! ❤ )
LikeLike
Pingback: “my kind of Dane” … | Great Dane Gnosis
Pingback: Connecting the dots | Great Dane Gnosis